Conflict Statistics
UCDP/PRIO Armed Conflict Dataset
Deaths, Incidences, Globally
import pandas as pd

def overall_deaths(mon):
   url = 'https://ucdp.uu.se/downloads/candidateged/GEDEvent_v21_0_%d.csv' % mon
   df = pd.read_csv(url)
   g = df[['country','deaths_b']].\
       groupby(['country']).\
       agg({'country':'count', 'deaths_b': 'sum'})
   g.columns = ['incidents','deaths']
   return g.sort_values('deaths',ascending=False)

print (overall_deaths(mon=5).head(20))
                          incidents  deaths
country
Afghanistan                    1236    6473
Yemen (North Yemen)              74    1676
Nigeria                         266     551
Chad                              6     440
Somalia                          50     339
Mali                             40     166
Syria                           118     156
Ethiopia                        132     138
DR Congo (Zaire)                173     128
Iraq                             61     109
Burkina Faso                     43      71
India                            47      57
Mexico                          566      54
Myanmar (Burma)                 131      50
Central African Republic         23      48
Israel                           35      44
Philippines                      27      44
Niger                            20      36
Cameroon                         61      33
Pakistan                         33      29
Details for Specific Country
def country_attacked(mon, country):
   url = 'https://ucdp.uu.se/downloads/candidateged/GEDEvent_v21_0_%d.csv' % mon
   df = pd.read_csv(url)
   df1 = df[df.country == country]
   g = df1[['country','deaths_b','side_b']].\
       groupby(['side_b','country']).\
       agg({'side_b':'count', 'deaths_b': 'sum'})
   g.columns = ['incidents','deaths']
   return g.sort_values('deaths',ascending=False)

print (country_attacked(5, 'Syria'))
                               incidents  deaths
side_b                country
IS                    Syria           29      90
SDF                   Syria           37      36
Syrian insurgents     Syria           32      19
Government of Syria   Syria            3       9
Hamza Division        Syria            1       2
Al-Jabha al-Shamiyyah Syria            1       0
Civilians             Syria           14       0
Government of Israel  Syria            1       0
GDELT
Iraq and Syria based conflict stats. GDELT uses natural language processing (“AI”) to extract Actor - Action - Actor triplets. The result is not curated, there can be mistakes, but as an overall outlook, it can be useful.
US military bases, Syria, reverse-engineered from source, are also added.
The output of the code is below
GDELT, Troop Deployments
Filtering on CAMEO code 154 (military deployment), attempting to extract geoloc from the text itself, and filtering for the word ‘troop’ in the URL. No regional filtering, we attempt to find worldwide deployments, by all countries.
GDELT, BLM
Scanning events of the the last month looking for black deaths due to police shootings.
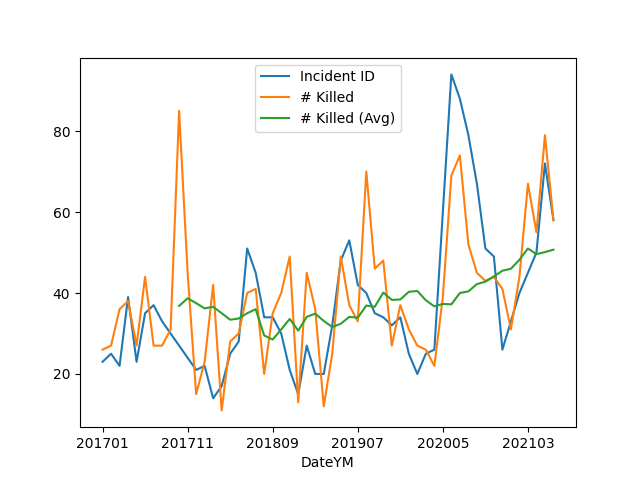
US Gun Violence
Data came from the Gun Violence Archive, see data for “mass shootings - all years”. Plot is monthly incidents and deaths.
import pandas as pd, zipfile
with zipfile.ZipFile('mass-shooting-us.zip', 'r') as z:
      df =  pd.read_csv(z.open('USmassshooting.csv'))

df['Date'] = df.apply(lambda x: pd.to_datetime(x['Incident Date']), axis=1)
df['DateYM'] = df.apply(lambda x: "%d%02d" % (x['Date'].year, x['Date'].month), axis=1)
g = df.groupby('DateYM').agg({'Incident ID':'count', '# Killed': 'sum'})
g['# Killed (Avg)'] = g['# Killed'].rolling(10).mean()
print (g[['# Killed','# Killed (Avg)']].tail(5))
g.plot()
plt.savefig('gunvio.png')
        # Killed  # Killed (Avg)
DateYM
202102        44            48.2
202103        67            51.0
202104        55            49.6
202105        79            50.1
202106        58            50.7