Why Are Democracies Better?
B. de Mesquita’s research indicates democratic nations are richer, and they are richer because of democracy. The relationship is not mere correlation - it is causation. But we need to define democracy carefully.
A country’s well-being depends on the size of its “winning coalition”, let’s give it the variable W, the larger the better (in democratic countries W is the entire population).
Winning coalition W is # of people whose support a leader needs to rule, this is the group of people he needs to keep happy to stay in power, selectorate S is the # of people from among which members of W are recruited.
With small W, leader only needs to keep a small group happy paying them off is easier, with large W, bribe becomes harder so leader must emphasize public services, striving to be elected on the basis of policy. S in a democracy is the entire electorate, for autocracies a much smaller group would do i.e. the military, or some sort of “guard”, or a single party out of which even a smaller W would select the leader.
In The Logic of Political Survival BBM makes the case that it is better to use W as a measure of better governance. According to this research increases in W effect GDP growth positively. Here is the causation part - BdM calculates increase in W based as difference between W of two years ago and calculates its relation between the current year’s growth. The relation exists.
BdM also controls for what it is traditionally known as democracy. In a separate regression he takes out effects of W,S from inside this traditional “democracy” variable, so what remains (the residuals) are taken to be all other parts (benefits?) of democracy that is not related to W or S. This residual has no effect on the regression, meaning traditional concept of democracy is irrelevant.
Another hypothesis is that there is a dependence between kleptocracy and W, S; and yes the book finds government theft is maximal when W is small and S is large, signifying a rigged electoral system where the electorate is large but their votes do not count, an inner circle decides everything. With bigger W, kleptocracy decreases.
Once the general richness of society is accounted for, there is a negative correlation between construction (an area ripe for government theft) and the winning coalition size, W, meaning better governance means less construction that involve theft. Rich societies naturally build more, or they build in proportion to their income, and if they are governed well no more than necessary. The “more” of this extra construction can involve shady dealings and that part is caught by the regression.
Elections
US elections (most likely elections in other democratic countries as well) are decided as a go / no-go decision on the incumbent party. While judging the incumbent only three variables are used: GDP growth, party incumbency (second term or not), and incumbent executive’s net approval rating. The prediction works very well on almost all US election data.
It is interesting the analysis works well with such rough / few numbers such as growth and general popularity. But in a way this makes sense; Voting for a single person is a blunt instrument really, hence, the basis people use to judge it is also pretty general. If a party stays in power for too long, people want to throw them out, if there is no growth, the incumbent is not popular, the climb for the candidate from that party becomes steeper and steeper. The method is very smart in some sense because the only reliable data the electorate has can only be based on existing accomplishments (through these general variables), that’s why the vote is based incumbent, i.e. the person on whom people have the best available data.
People do not judge candidates by looking at the totality of their policy positions (hmm I assign a number from 1 to 10 to each position, then average them all, compare both candidates,that is the likelihood of my vote). People are much better deciding on people, not on issues. This also implies that a win does not validate a politician’s all policy positions, since people mostly did not give a shit about them. Taking the vote as a confirmation of all previously positions, locking them in, or thinking people are some kind of magical policy oracle is a fallacy. Everyone has a job to do - modernity is based on the division of labor. Post-modernity could be something else, we are not there yet.
Which election system is best? BdM has good things to say on the French run-off system, being more demanding. From BdM’s The Dictator’s Handbook:
“It is worth observing that the United States has one of the world’s biggest winning coalitions both in absolute numbers and as a proportion of the electorate. But it is not the biggest. Britain’s parliamentary structure requires the prime minister to have the support of a little over 25 percent of the electorate in two-party elections to parliament. That is, the prime minister generally needs at least half the members of parliament to be from her party and for each of them to win half the vote (plus one) in each two-party parliamentary race: half of half of the voters, or one quarter in total. France’s runoff system is even more demanding. Election requires that a candidate win a majority in the final, two-candidate runoff.”
On the other hand, another research, which looked at parliamentary vs presidential systems in terms of economy, came up with a different answer: purely parliamentary system.
Paper by McManus et al.
I dont have the time to dig into this yet (to replicate it in Python) – here is the data (from Dr. McManus).
Coalitions
In democratically backward countries that live in a comotose, proto-fascistic state a “coalition” is created beforehand, in the mind of a fascist, and any ideology that is outside of this legit mix is immediately delegitimized. This is a mistake. The emergent, self-organized blocks of ideologies, as clusters, carry within a good signal, if enough though leaders coalesced around something, chances are there is an approach that needs representing.
Logistically coalitions are fine, but you need ideologically distinct parties.. There can be no gaps, nothing left out, otherwise fascists will step in to fill the void. Obviously some coalitions will be able to deliver more than others, but at least seperate parties decide how that coalition is formed, on their own terms. Each viewpoint contributes, and by averaging the optimal decision is reached.
BTW “average” could also be a long-run average between two (or more) views (cld be immed avg too). One party cld be for 30% tax rate, another for 70%. Each enact their thing one in power, if they can, long-running average is 50%.
War
Democracies are better at war. They win almost all the wars they start and about two-thirds of the wars in which they are targets of aggression. Democracies are better able to make war collectively. Autocracies, with the small winning coalitions [..] tend to seek private benefits from fighting. A thirst for private goods means that autocracies optimize at a smaller coalition size to avoid diluting the spoils of war. Democracies, in contrast, already supply public goods to large domestic winning coalitions [4]. In essence, since democratic leaders need to inform the public and provide public goods, and war is always ugly, they have a huge interest in finishing the war as soon as possible. To that end they mobilize better, plan more effectively and fight to finish. This makes them better fighters. Autocrats can hide the goings-on of a war, so they would never feel the pressure to finish, hence do not fight in a way that’ll help them do so. The war drags on.
Democratic Status
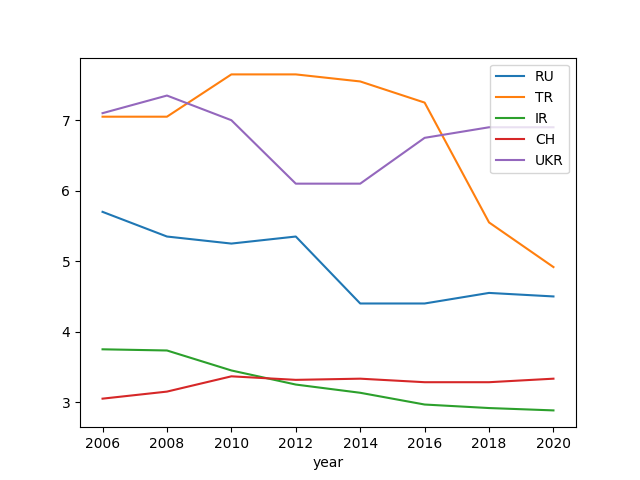
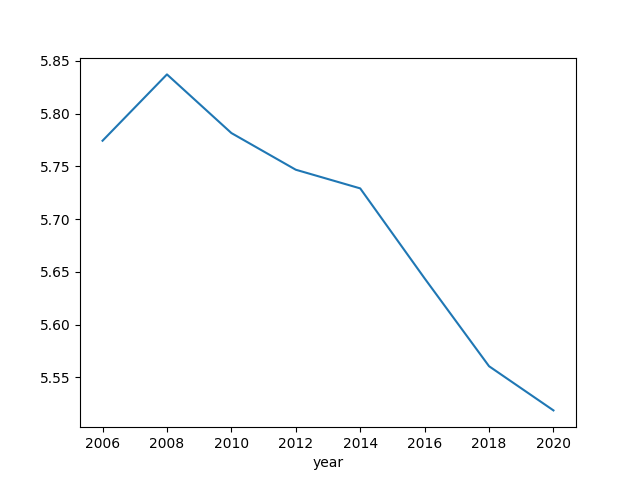
Data comes from the BTI Transformation Index that evaluates aspects of governance for selected countries, recently updated for 2020.
import pandas as pd
df = pd.read_stata('../../tweets/2020/BTI 2006-2020.dta')
df = df.set_index('year')
df1 = df[df.country == 'Russia'].dem_stat
df2 = df[df.country == 'Turkey'].dem_stat
df3 = df[df.country == 'Iran'].dem_stat
df4 = df[df.country == 'China'].dem_stat
df5 = df[df.country == 'Ukraine'].dem_stat
df3 = pd.concat([df1,df2,df3,df4,df5],axis=1)
df3.columns = ['RU','TR','IR','CH','UKR']
df3.plot()
plt.savefig('bti-compare.png')
import pandas as pd
df = pd.read_stata('../../tweets/2020/BTI 2006-2020.dta')
g = df.groupby('year').dem_stat.mean()
g.plot()
plt.savefig('bti-all.png')
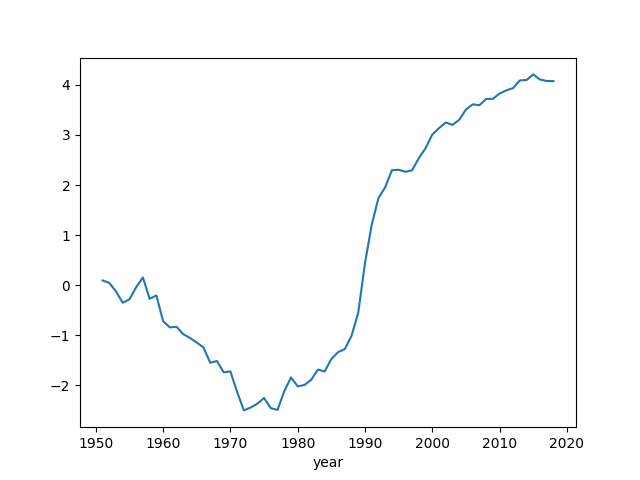
Polity
Here is democracy status from the Polity dataset. Their DEMOC and
AUTOC columns contain the level of insititutional leanings of a
country, POLITY column is one subtracted from the other, it ranges
btw -10 and +10, the latter being full democracy.
import pandas as pd
df = pd.read_excel('../../tweets/2020/p4v2018.xls')
df = df[df.year > 1950]
df.loc[df.polity < -10, 'polity'] = np.nan
df['polity'] = df['polity'].interpolate(method='linear')
polity = df.groupby('year')['polity'].mean()
polity.plot()
plt.savefig('polity-all.png')
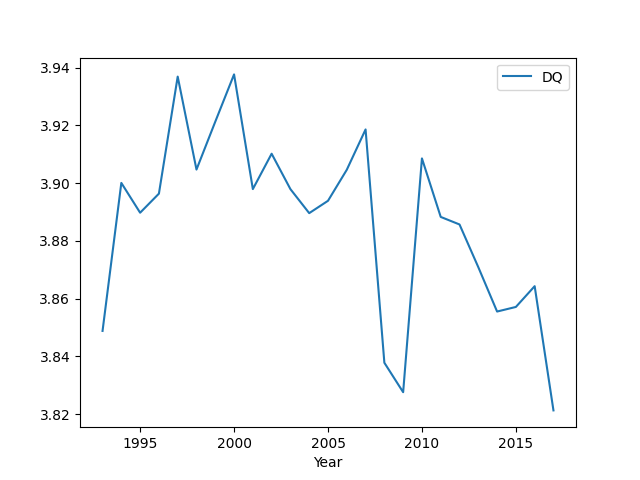
Democracy Barometer
import zipfile
with zipfile.ZipFile('db.zip', 'r') as z:
   df = pd.read_csv(z.open('DB_data_2020_all_data_Standardised.csv'),sep=';')
   df = df[['Year','DQ']].groupby('Year').mean()
   print (df.tail(5))
   df.plot()

plt.savefig('db-all.png')
            DQ
Year
2013  3.870913
2014  3.855549
2015  3.857140
2016  3.864331
2017  3.821315
References
[4] The Logic of Political Survival, B. de Mesquita